Portfolio case study

RI Flood Insurance

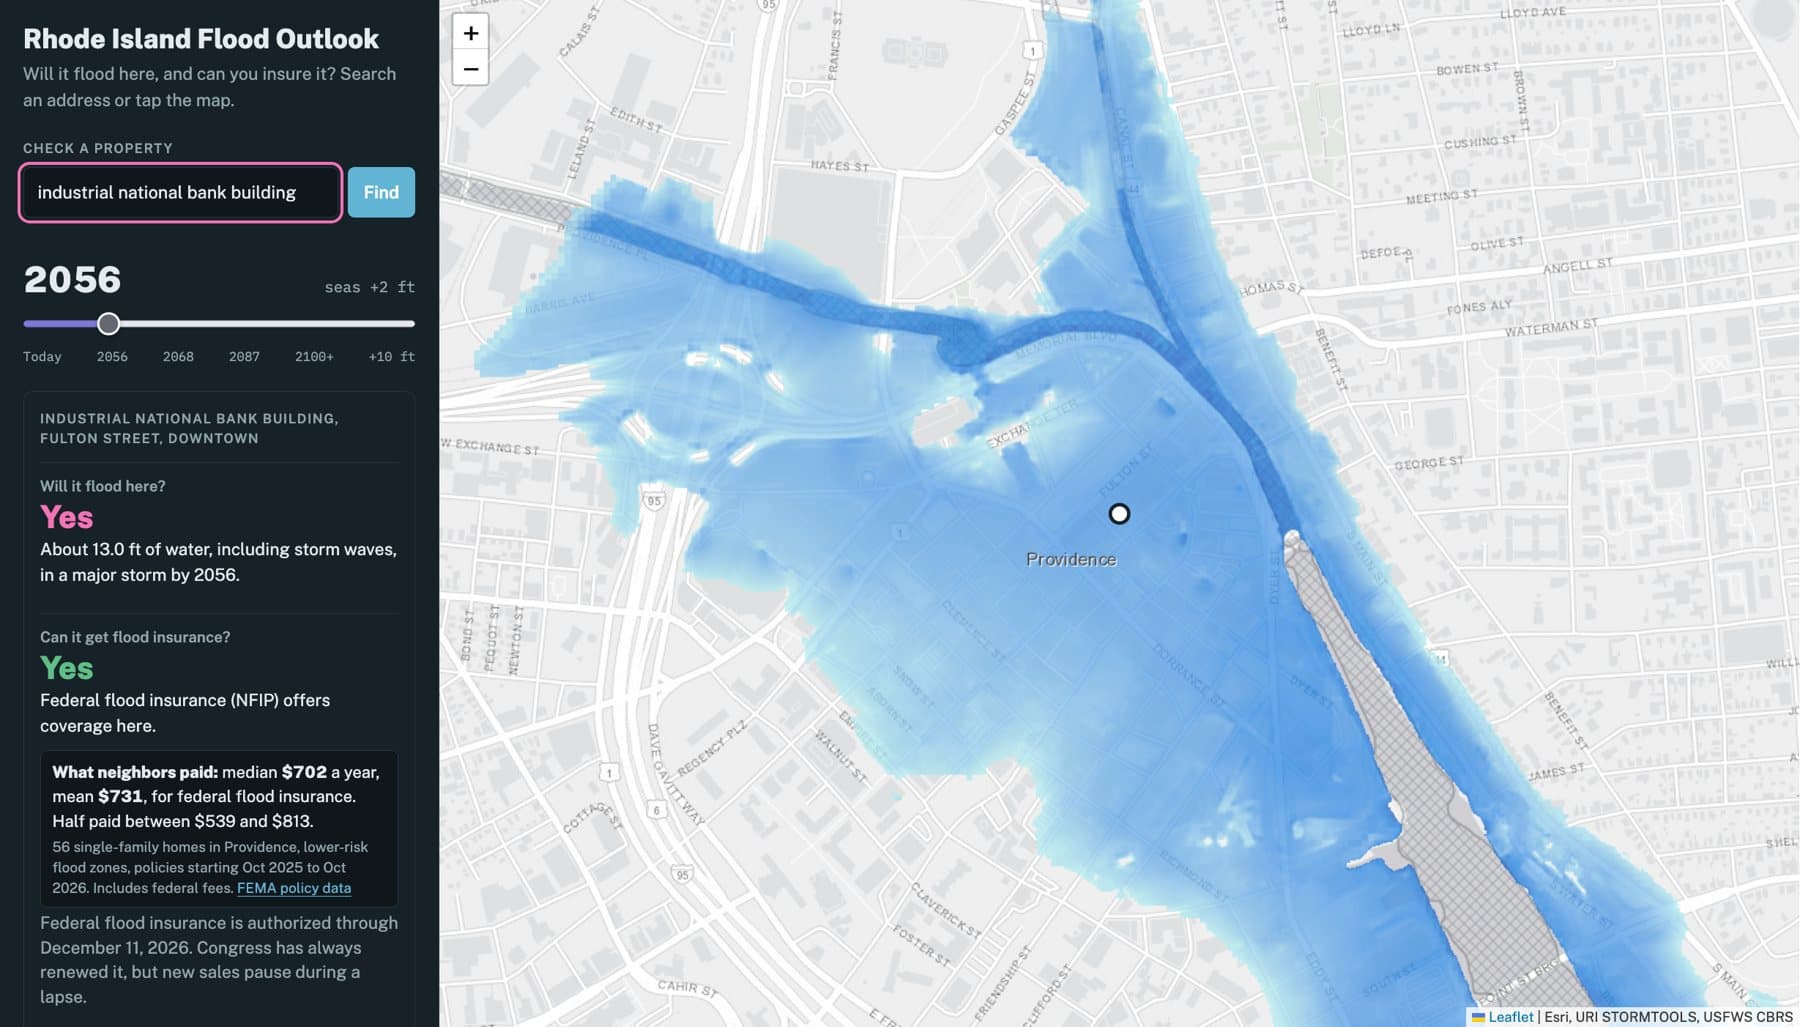
A Rhode Island map that answers three questions for any address: will it flood, can it get flood insurance, and can it get homeowners insurance. Drag a slider to see the answer as seas rise, and see what neighbors actually paid. Every answer is built from public data published by the agencies and companies that own it, and an LLM reads insurers' rules under checks strict enough to measure.

  • Python
  • FastAPI
  • Pydantic
  • Ollama (gemma4, gpt-oss)
  • Leaflet
  • ArcGIS REST services
  • Playwright
  • pytest
  • GitHub Actions

Built on data from

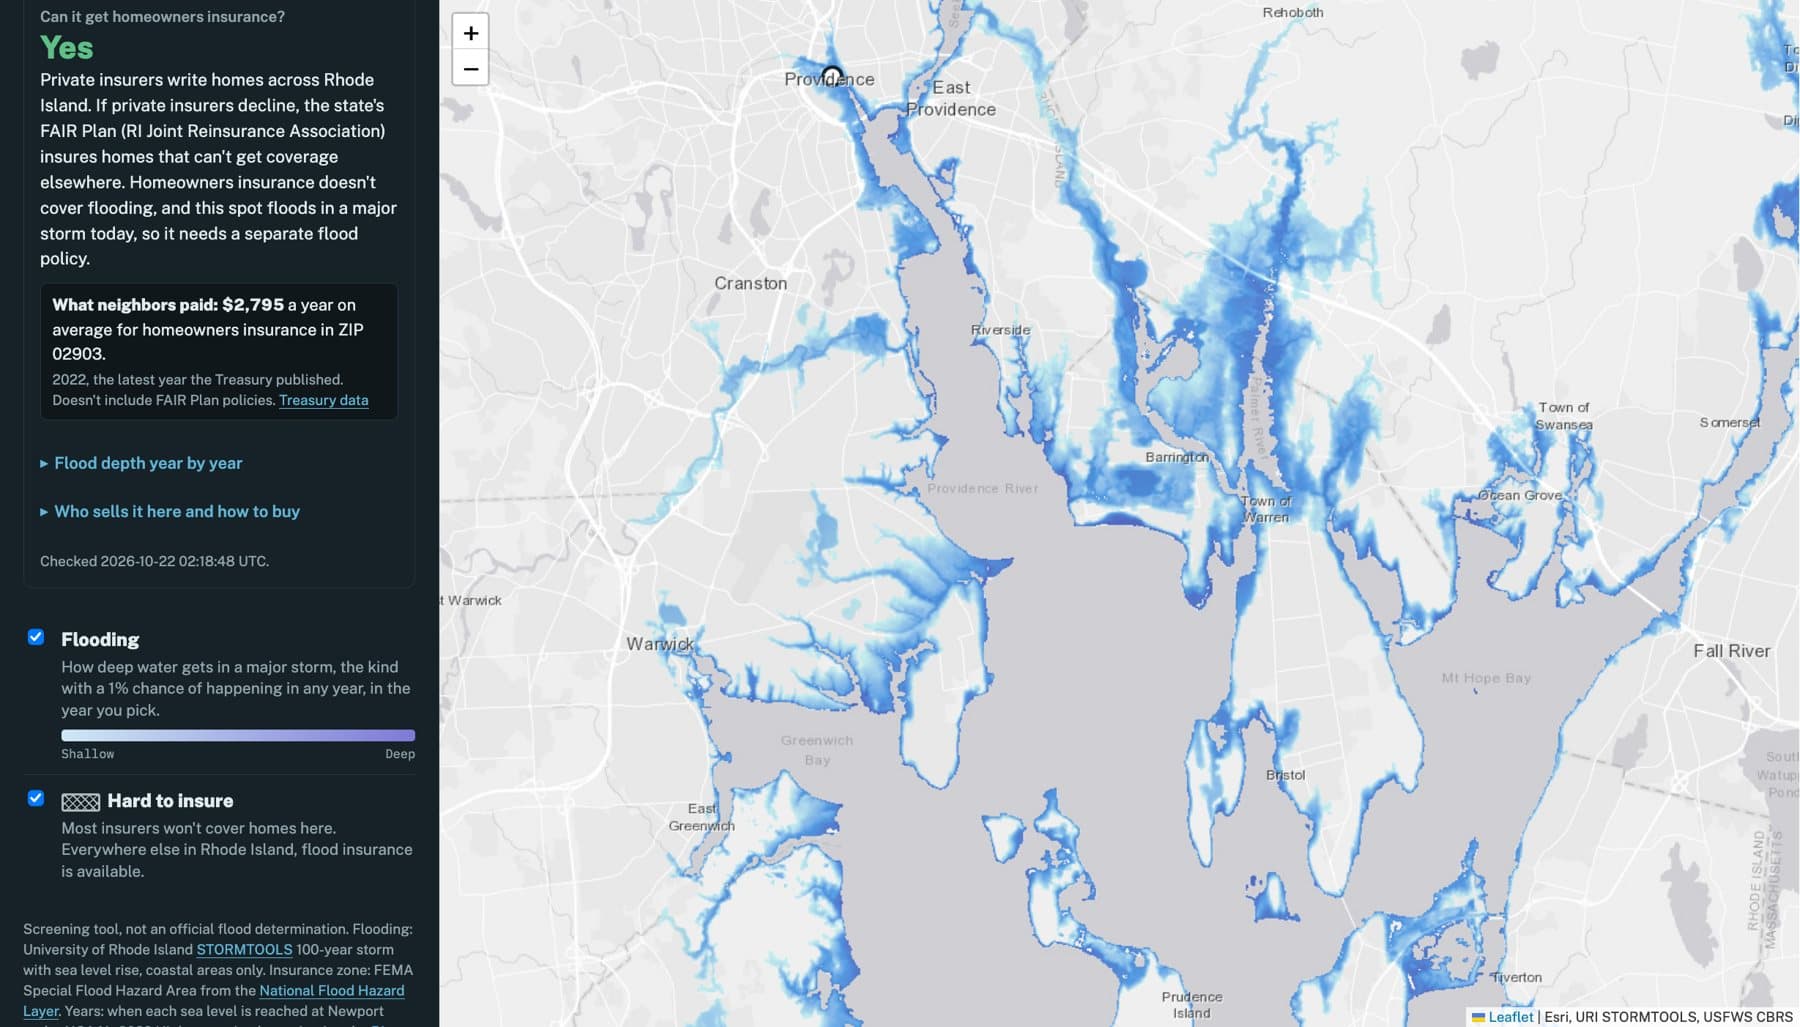
Narragansett Bay: storm flooding and the card's three answers

1/2

How it works

  1. 1. Look up

    FEMA zone, URI storm depth for each sea level, coastal barrier unit, town, tract and ZIP

  2. 2. Decide

    The federal program plus each insurer's reviewed rules: available, maybe or not offered, with the quote behind it

  3. 3. Price

    What neighbors paid: FEMA policy medians by tract and flood zone, Treasury homeowners averages by ZIP

  4. 4. Check

    Quote-verified rules, an eval in CI, browser tests, and nightly checks of every live source

By the numbers

precision extracting insurers' rules (gemma4 31B, mean of 3 runs)
97%
precision extracting insurers' rules (gemma4 31B, mean of 3 runs)
recall on 10 hand-labeled insurer documents
96%
recall on 10 hand-labeled insurer documents
FEMA flood policies behind “what neighbors paid”
7,329
FEMA flood policies behind “what neighbors paid”
automated tests in CI, plus browser and nightly live checks
~160
automated tests in CI, plus browser and nightly live checks

Shipped

  • A map that answers three questions for any Rhode Island address (will it flood, can it get flood insurance, can it get homeowners insurance) with a slider for sea-level rise and the source behind every answer.
  • A Python service where an LLM reads insurers' PDFs and returns their eligibility rules as typed, schema-checked JSON. A rule survives only if it quotes the document, and a program reaches the map only after it matches hand-checked labels.
  • “What neighbors paid”: the median and middle half of what single-family homes nearby paid for federal flood insurance, and the ZIP's average homeowners premium and non-renewal rate, rebuilt monthly from FEMA and Treasury data.
  • A source audit of every number on the map, which corrected a sea-level projection that had shown flooding 15 to 30 years early.

Engineering highlights

An LLM that has to show its work

  • Every extracted rule must quote the insurer's document; if the quote isn't in the PDF's text, the rule is dropped.
  • A dollar limit only counts if the amount is in its quote. The model once read “20% of the dwelling limit” and wrote down $450,000.
  • Nothing reaches the map until it's reviewed: a program is published only if whether it's sold in Rhode Island, its location exclusions and its flood-zone rules match labels checked by hand against the document.
  • Swappable backends (Ollama Cloud models or Claude) behind one interface, with long documents read a few pages at a time.

Evals that changed the system

  • 12 public insurer documents labeled line by line, scored for precision and recall on every rule, repeated three times to report the range.
  • gemma4 31B scored 97% precision and 96% recall, identically across runs; gpt-oss 120B, four times the size, scored 84% and 64% and swung 11 points between runs.
  • The verifier now reports the closest passage for every rejection. That showed all 14 rejections were real table cells failing a three-word minimum; fixing it recovered 9 points of recall.

Data checked against its source

  • Sea-level years now follow NOAA's 2022 High scenario, which Rhode Island's coastal regulator requires; the older 2017 curve had the map showing future flooding 15 to 30 years early.
  • Depth is the storm model's value at the point, not the deepest water within 20 meters, which overstated it by up to 3 feet next to open water.
  • Two homeowners claims that came from a realtor's column were replaced with Treasury data, which contradicted one of them.
  • Neighbor costs cross-check against FEMA's own count: about 12,000 Rhode Island policies, and 11,328 insured units in a one-year window.

Operate what you ship

  • Lookups run server-side with timeouts, retries, caching and a fallback to direct calls; one failing agency marks its answer “couldn't check” instead of failing the page.
  • Per-request traces with a span for every call to FEMA, URI, USFWS and OpenStreetMap, and a status page with each source's health and a timeline of recent lookups. The timeline showed six storm-model calls running one after another; they now run in parallel.
  • Playwright drives the real page against recorded data on every push, and caught a status-page bug before it shipped.
  • Nightly checks against the live services open a GitHub issue if FEMA renames a field, URI reorders its rasters or FEMA's data goes stale. The deploy script is rehearsed on a fresh machine on every push.

Still open

  • Neptune Flood isn't on the map yet: its 2023 agent guide excludes coastal barrier properties, its website says it covers them, and every free model misread its state table.
  • MSI's September 2025 training deck disagrees with its earlier guide on islands, and lists 14 states for Hiscox FloodPlus sold through MSI, none of them Rhode Island. Both are questions for the carriers before the map changes.
  • FEMA rates downtown Providence as lower-risk, with the Fox Point Hurricane Barrier just south of it. Whether URI's storm model accounts for the barrier is an open question.

A screening tool, not an official flood determination. Insurers make the final call on every home.